
E-Malt news
UK: Diageo Belfast brewery workers vote to strike ahead of Christmas
Ireland: Malting Company of Ireland�s profit after tax up �760,000
USA, NY: Port Jeff Brewing Company to close its doors by the end of the year
USA, OH: Starflyer Brewing Co. ready to open its doors in Canton
Vores malt


Vores humle


New Hops
Vores gær


Vores krydderier


Vores sukker

Vores kapsler
-
 Kapsler 26mm TFS-PVC Free, Gold Neu Matt col. 2981 (10000/papkasse)
Tilføj kurv
Kapsler 26mm TFS-PVC Free, Gold Neu Matt col. 2981 (10000/papkasse)
Tilføj kurv
-
 Kegcaps 69 mm, Rød 102 Grundey G-type (850/papkasse)
Tilføj kurv
Kegcaps 69 mm, Rød 102 Grundey G-type (850/papkasse)
Tilføj kurv
-
 Kegcaps 64 mm, Rose 1215 Sankey S-type (EU) (1000/papkasse)
Tilføj kurv
Kegcaps 64 mm, Rose 1215 Sankey S-type (EU) (1000/papkasse)
Tilføj kurv
-
Kegcaps 74 mm, Rød 102 Flatfitting A-type (700/papkasse)
Tilføj kurv
-
Kegcaps 74 mm, Blå 141 Flatfitting A-type (700/papkasse)
Tilføj kurv
Certifikater
 Top Hop - Non GMO Certificate 2021
 ChF Hops Conformity Certificate
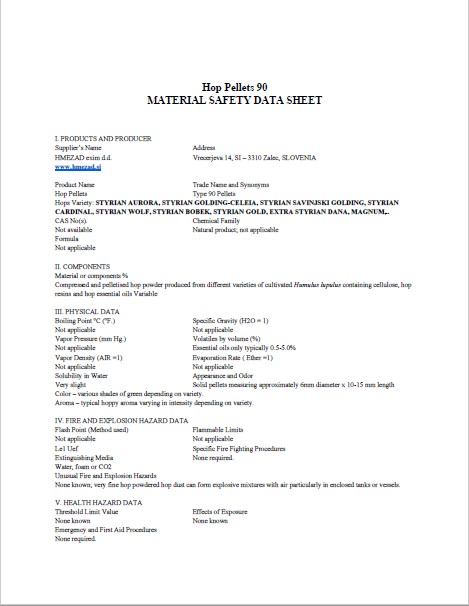 HMEZAD Hops - Material Safety data sheet 2022
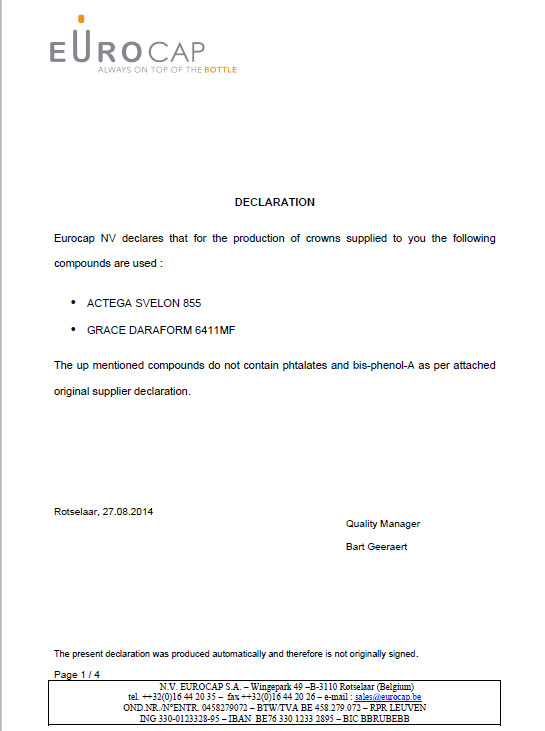 Crown Caps EUROCAP Bisphenol EN
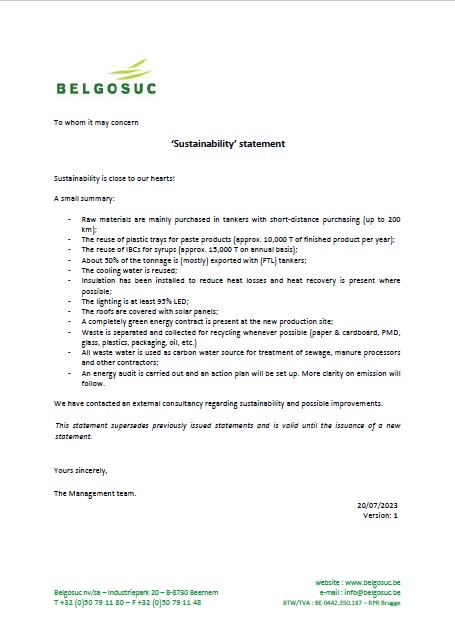 Belgosuc Sugar, Certificate of conformity (EN)
Forslag
Join us


 USA: Beer market forecast to experience a slight increase in performance within the next ten years
Driven by rising demand, the beer market in the United States is projected to experience a slight increase in performance, with an expected CAGR of +0.6% from 2024 to 2035. This growth is also reflected in the market value, which is forecasted to reach $35B by the end of 2035, IndexBox said in their latest report on the US beer market.
Driven by rising demand for beer in the United States, the market is expected to start an upward consumption trend over the next decade. The performance of the market is forecast to increase slightly, with an anticipated CAGR of +0.6% for the period from 2024 to 2035, which is projected to bring the market volume to 27B litres by the end of 2035.
In value terms, the market is forecast to increase with an anticipated CAGR of +0.6% for the period from 2024 to 2035, which is projected to bring the market value to $35B (in nominal wholesale prices) by the end of 2035.
In 2024, consumption of beer increased by 1.3% to 25B litres, rising for the fourth year in a row after four years of decline. Overall, consumption, however, continues to indicate a relatively flat trend pattern. As a result, consumption reached the peak volume of 26B litres. From 2015 to 2024, the growth of the consumption remained at a lower figure.
The value of the beer market in the United States amounted to $32.7B in 2024, increasing by 2.5% against the previous year. This figure reflects the total revenues of producers and importers (excluding logistics costs, retail marketing costs, and retailers' margins, which will be included in the final consumer price).
Over the period under review, consumption, however, continues to indicate a relatively flat trend pattern. The pace of growth appeared the most rapid in 2021 when the market value increased by 3.9% against the previous year. Over the period under review, the market hit record highs at $35.9B in 2018; however, from 2019 to 2024, consumption remained at a lower figure.
Beer production in the United States amounted to 20B litres in 2024, remaining stable against 2023 figures. Over the period under review, production, however, recorded a relatively flat trend pattern. The pace of growth appeared the most rapid in 2014 when the production volume increased by 0.3%. As a result, production attained the peak volume of 23B litres. From 2015 to 2024, production growth remained at a lower figure.
In value terms, beer production reached $25.4B in 2024. Overall, production, however, showed a slight decrease. The pace of growth was the most pronounced in 2021 when the production volume increased by 2.4%. Beer production peaked at $31.3B in 2013; however, from 2014 to 2024, production failed to regain momentum.
In 2024, the amount of beer imported into the United States expanded remarkably to 5B litres, with an increase of 5.6% on the previous year's figure. The total import volume increased at an average annual rate of +4.0% over the period from 2013 to 2024; however, the trend pattern indicated some noticeable fluctuations being recorded throughout the analyzed period. The pace of growth was the most pronounced in 2014 with an increase of 12%.
Over the period under review, imports attained the peak figure in 2024 and are likely to see steady growth in years to come. In value terms, beer imports expanded markedly to $7.7B in 2024. Overall, total imports indicated a prominent expansion from 2013 to 2024: its value increased at an average annual rate of +6.3% over the last eleven-year period. The trend pattern, however, indicated some noticeable fluctuations being recorded throughout the analyzed period. Based on 2024 figures, imports increased by +95.9% against 2013 indices. As a result, imports attained the peak and are likely to continue growth in the immediate term.
In 2023, Mexico (3.8B litres) constituted the largest supplier of beer to the United States, with a 81% share of total imports. Moreover, beer imports from Mexico exceeded the figures recorded by the second-largest supplier, the Netherlands (421M litres), ninefold. The third position in this ranking was held by Canada (132M litres), with a 2.8% share. From 2013 to 2023, the average annual rate of growth in terms of volume from Mexico totaled +7.5%. The remaining supplying countries recorded the following average annual rates of imports growth: the Netherlands (-3.0% per year) and Canada (-5.7% per year).
In value terms, Mexico ($5.7B) constituted the largest supplier of beer to the United States, comprising 83% of total imports. The second position in the ranking was held by the Netherlands ($630M), with a 9.2% share of total imports. It was followed by Ireland, with a 2.2% share. From 2013 to 2023, the average annual growth rate of value from Mexico totaled +11.1%. The remaining supplying countries recorded the following average annual rates of imports growth: the Netherlands (-3.5% per year) and Ireland (-1.9% per year).
The average beer import price stood at $1.5 per litre in 2023, with an increase of 3% against the previous year. Over the period from 2013 to 2023, it increased at an average annual rate of +1.9%. The most prominent rate of growth was recorded in 2015 an increase of 8% against the previous year. The import price peaked in 2023 and is expected to retain growth in the immediate term. Prices varied noticeably by country of origin: amid the top importers, the country with the highest price was Belgium ($2.8 per litre), while the price for Canada ($816 per thousand litres) was amongst the lowest. From 2013 to 2023, the most notable rate of growth in terms of prices was attained by Belgium (+6.3%), while the prices for the other major suppliers experienced more modest paces of growth.
In 2024, beer exports from the United States dropped remarkably to 199M litres, reducing by -16.5% compared with 2023 figures. Over the period under review, exports recorded a deep reduction. The pace of growth appeared the most rapid in 2015 with an increase of 17% against the previous year. Over the period under review, the exports reached the peak figure at 698M litres in 2018; however, from 2019 to 2024, the exports remained at a lower figure. In value terms, beer exports expanded notably to $353M in 2024. Overall, exports recorded a perceptible downturn. The most prominent rate of growth was recorded in 2019 with an increase of 20% against the previous year. As a result, the exports reached the peak of $806M. From 2020 to 2024, the growth of the exports remained at a somewhat lower figure.
Honduras (32M litres), Canada (31M litres) and Chile (26M litres) were the main destinations of beer exports from the United States, together comprising 37% of total exports. From 2013 to 2023, the most notable rate of growth in terms of shipments, amongst the main countries of destination, was attained by Honduras (with a CAGR of +11.9%), while the other leaders experienced more modest paces of growth. In value terms, the largest markets for beer exported from the United States were Canada ($55M), Honduras ($46M) and Chile ($35M), with a combined 41% share of total exports. In terms of the main countries of destination, Honduras, with a CAGR of +19.6%, recorded the highest rates of growth with regard to the value of exports, over the period under review, while shipments for the other leaders experienced more modest paces of growth.
The average beer export price stood at $1.4 per litre in 2023, with an increase of 7.3% against the previous year. Over the period under review, export price indicated a moderate expansion from 2013 to 2023: its price increased at an average annual rate of +2.9% over the last decade. The trend pattern, however, indicated some noticeable fluctuations being recorded throughout the analyzed period. Based on 2023 figures, beer export price decreased by -5.6% against 2019 indices. The pace of growth was the most pronounced in 2019 an increase of 54%. As a result, the export price attained the peak level of $1.5 per litre. From 2020 to 2023, the average export prices failed to regain momentum. There were significant differences in the average prices for the major overseas markets. In 2023, amid the top suppliers, the country with the highest price was Sweden ($2 per litre), while the average price for exports to Mexico ($1 per litre) was amongst the lowest. From 2013 to 2023, the most notable rate of growth in terms of prices was recorded for supplies to Panama (+8.0%), while the prices for the other major destinations experienced more modest paces of growth.
Tilbage